
What does the supplier need to calculate?
The supplier is based in Indonesia. Its accounting period is 1 January–31 December 2024, and its records are kept separately from the farm’s. It needs two things: the emissions associated with the fertilizer in this sample, and the amount of fertilizer produced. Dividing the first by the second gives emissions per kilogram of product, called a product carbon footprint, or PCF. CO₂e is a common unit for greenhouse gas emissions. A rate in kgCO₂e/kg means kilograms of emissions for each kilogram of fertilizer. The two kg units measure different things.This is a small training model with known gaps. The data notes explain what a real fertilizer assessment would still need to review.
1. Calculate the gas emissions
The supplier burns natural gas in fixed equipment. This belongs in its Scope 1, which includes fuel it burns itself. Moya calls this stationary combustion, rather than fuel used in a vehicle. The activity record is 500 cubic metres of Natural gas, dated 12 December 2024. The saved DESNZ database rate is 2.06672 kgCO₂e per cubic metre. That rate is an emission factor, or EF. Multiplying the quantity by the factor gives: 500 × 2.06672 = 1,033.36 kgCO₂e. That accounts for the gas. The factory also buys electricity.2. Calculate the electricity emissions
Purchased electricity belongs in the supplier’s Scope 2.
The grid factor is the average emissions per unit of electricity for this location. The result is 500 × 0.584 = 292 kgCO₂e.
What about the market-based electricity option?
What about the market-based electricity option?
This record has no market-based factor, so Moya uses the local grid rate for that comparison too. Blank doesn’t mean zero.A separate market-based rate would need supporting electricity purchasing evidence. The supplier’s two comparisons both show 292 kgCO₂e here.
3. Include the purchased ammonia
Another company made the ammonia before it arrived at the fertilizer factory. These emissions belong in the supplier’s Scope 3: emissions associated with its business that occur outside its own operations. Category 1 — Purchased goods & services groups this purchase within Scope 3.
The calculation is activity-based: it uses the quantity bought, rather than the amount spent. The saved factor is 680 kgCO₂e per tonne of ammonia.
Your turn: the invoice says 1,000 kg, and the factor is per tonne. What emissions does that give?
Reveal the ammonia result
Reveal the ammonia result
680 kgCO₂e. There are 1,000 kg in a tonne, so this purchase is one tonne: 1 × 680 = 680 kgCO₂e.Moya records the conversion as 1 kg = 0.001 tonnes. Missing it would make the result a thousand times too large.
See the saved ammonia factor and currency details
See the saved ammonia factor and currency details
The database choice is CBAM → Ammonia in aqueous solution (28142000) → Indonesia, at 680 kgCO₂e/tonne.The invoice’s FX rate, meaning the exchange rate to US dollars, is 1 because the invoice is already in USD.
We have a total. To answer the farm’s question, we still need the quantity produced.
4. Work out the footprint per kilogram
The sample supplier produces 500 kg of fertilizer and sells all 500 kg. Its Product Inventory records these annual movements:
These quantities come from production, consumption, and stock records. Moya doesn’t infer production from a sale or closing-stock count.
These are the sample’s accounting movements, not a manufacturing recipe or chemical mass balance. Its 500 kg sale and the farm’s 1,000 kg purchase are separate demo entries.
Reveal the fertilizer footprint
Reveal the fertilizer footprint
4.01072 kgCO₂e/kg: 2,005.36 ÷ 500.This sample has one fertilizer output. The per-kg rate lets a buyer calculate the emissions for the quantity it purchases.
See the supplier's sale record
See the supplier's sale record
The sale is 500 kg of Fertilizer at USD 0.90/kg, dated 12 December 2024, for USD 450, with FX rate 1. Fertilizer is classified as Intermediary product because another business uses it.
5. Create the footprint in Moya
The supplier reviews the completed records and saves their inputs using Accounting year actions → Save version. It then creates Fertilizer, 2024 under My PCFs, selecting that saved Organization version as the calculation source. The PCF uses the 500 kg output and shows the rate we just calculated: 4.01072 kgCO₂e/kg.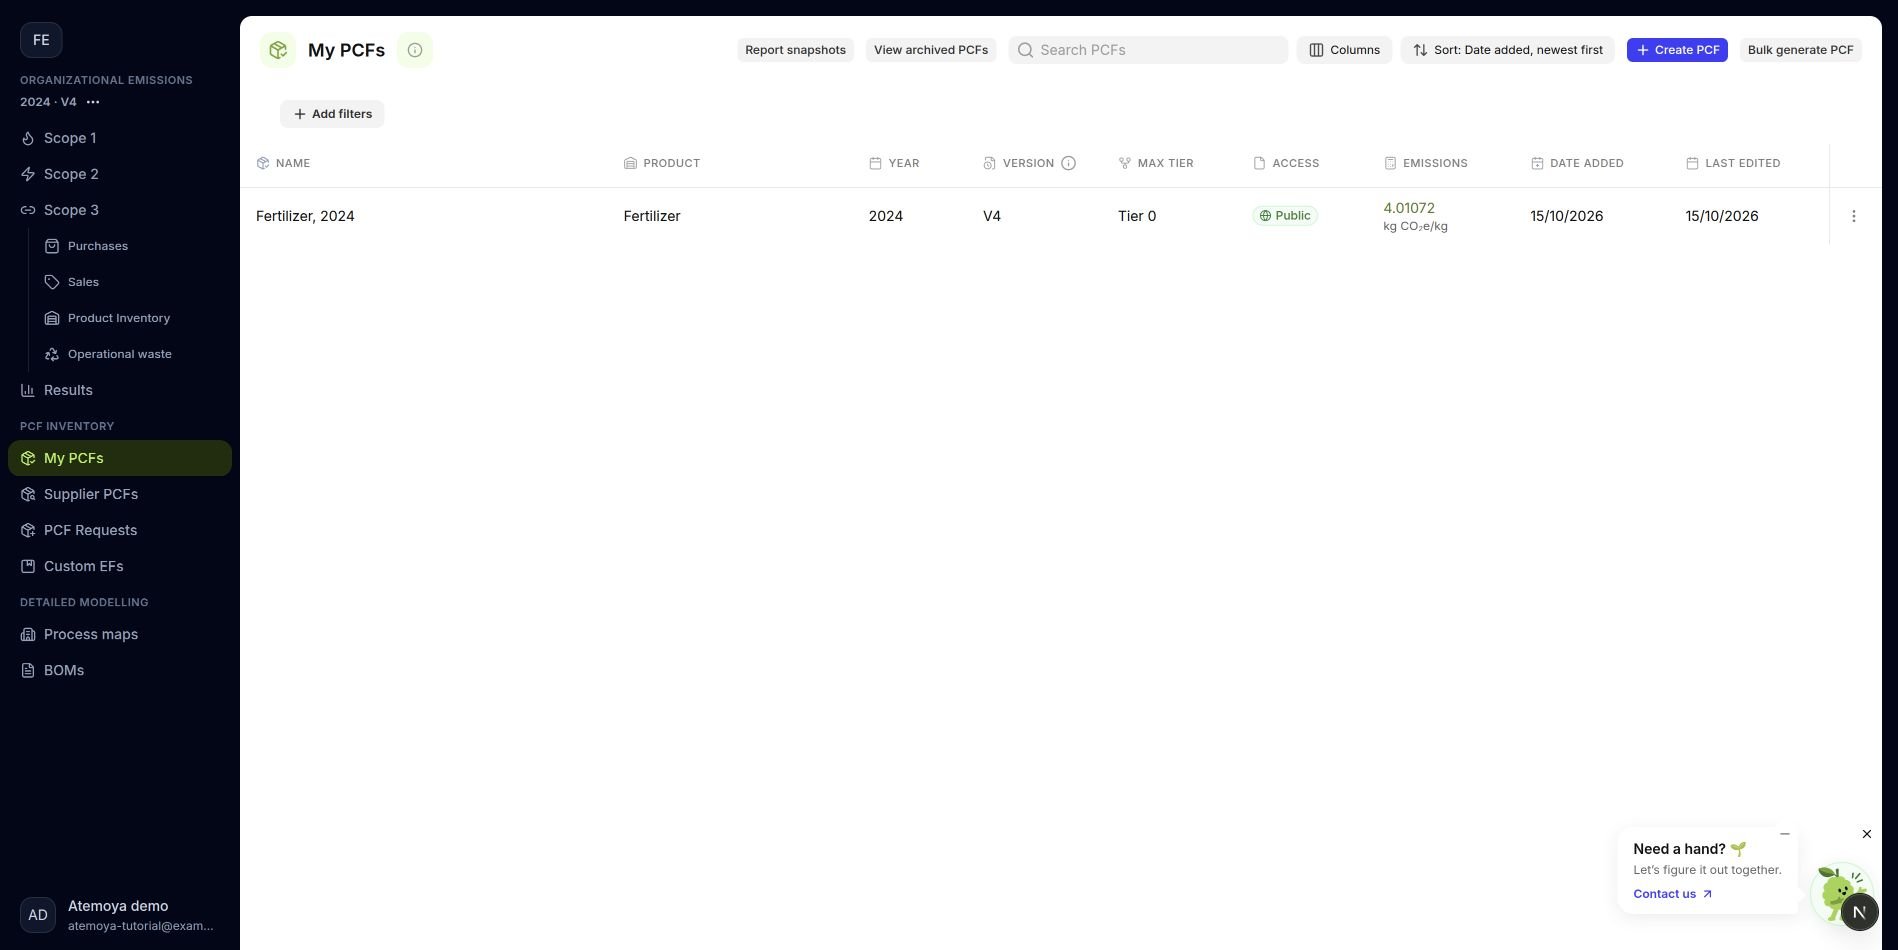
The supplier's completed Fertilizer, 2024 footprint, ready to share.
What do the version numbers mean?
What do the version numbers mean?
The demo’s footprint is PCF V4, based on organization V3. These labels identify saved versions of the footprint and its source records; they aren’t emissions rates.This footprint uses annual company records. The demo doesn’t use a separate product recipe, called a bill of materials or BOM.
6. Share the footprint with the farm
In the demo, Fertilizer, 2024 is public. The farm finds it in Supplier PCFs → Public library and adds it to its supplier inventory.How would the supplier respond to a private request instead?
How would the supplier respond to a private request instead?
The supplier can create a Restricted PCF and respond to the farm’s request under PCF Requests → Received → Share PCF. After checking the requesting company, product, and year, it selects Fertilizer, 2024 and shares it.The footprint then becomes available to the farm through that response. Public access makes it discoverable by other organizations instead.
Reveal the explanation
Reveal the explanation
The supplier buys the electricity to make fertilizer; it’s the supplier’s Scope 2. The farm buys the fertilizer; the supplier’s contribution reaches it through the fertilizer footprint used on that Scope 3 purchase.The two companies keep their own accounts. Sharing a PCF connects the product information; it doesn’t copy the factory’s electricity into the farm’s Scope 2.
About the sample data
What this small model leaves out
What this small model leaves out
The sample has no Category 3 upstream-energy purchases or other manufacturing activities. Before using it for reporting, review fuel and energy supply, process emissions, transport, waste, and other applicable sources. Adding records will change the result.The saved factors come from DESNZ 2025-flat, Electricity Maps 2024, and CBAM definitive-2026. These reproduce staging’s choices for the exercise; check the appropriate editions and methods for your report.
Keeping a fixed report value
Keeping a fixed report value
A saved organization version preserves the inputs. A snapshot captures the calculated values. See PCF versions and snapshots when you need a fixed record, and review the source and sharing settings when updating your footprint.